Last updated: May 24, 2026
Animal Mortality Rate Calculator

Creators
Dharmendra SinghReviewers
Creators
Dharmendra SinghReviewers
Quick Answer
The Animal Mortality Rate Calculator estimates livestock and wildlife mortality from inventory data using Mortality Rate = (Deaths ÷ Population at risk) × 100, where Deaths = Opening + Births − Sold − Closing and Population at risk = Opening + Births. It also reports survival rate, total deaths, and population at risk so you can compare herd performance against industry benchmarks.
Animal mortality rate is the number of deaths in a period divided by the population at risk, times one hundred. Deaths equal opening stock plus births minus animals sold and animals still alive at period end.
Key Takeaways
- Mortality rate = Deaths ÷ Population at risk × 100, where population at risk = opening stock + births
- Deaths are inferred from inventory: Deaths = Opening + Births − Sold − Closing (must be ≥ 0)
- Count only unintended losses — culled and sold animals are not deaths
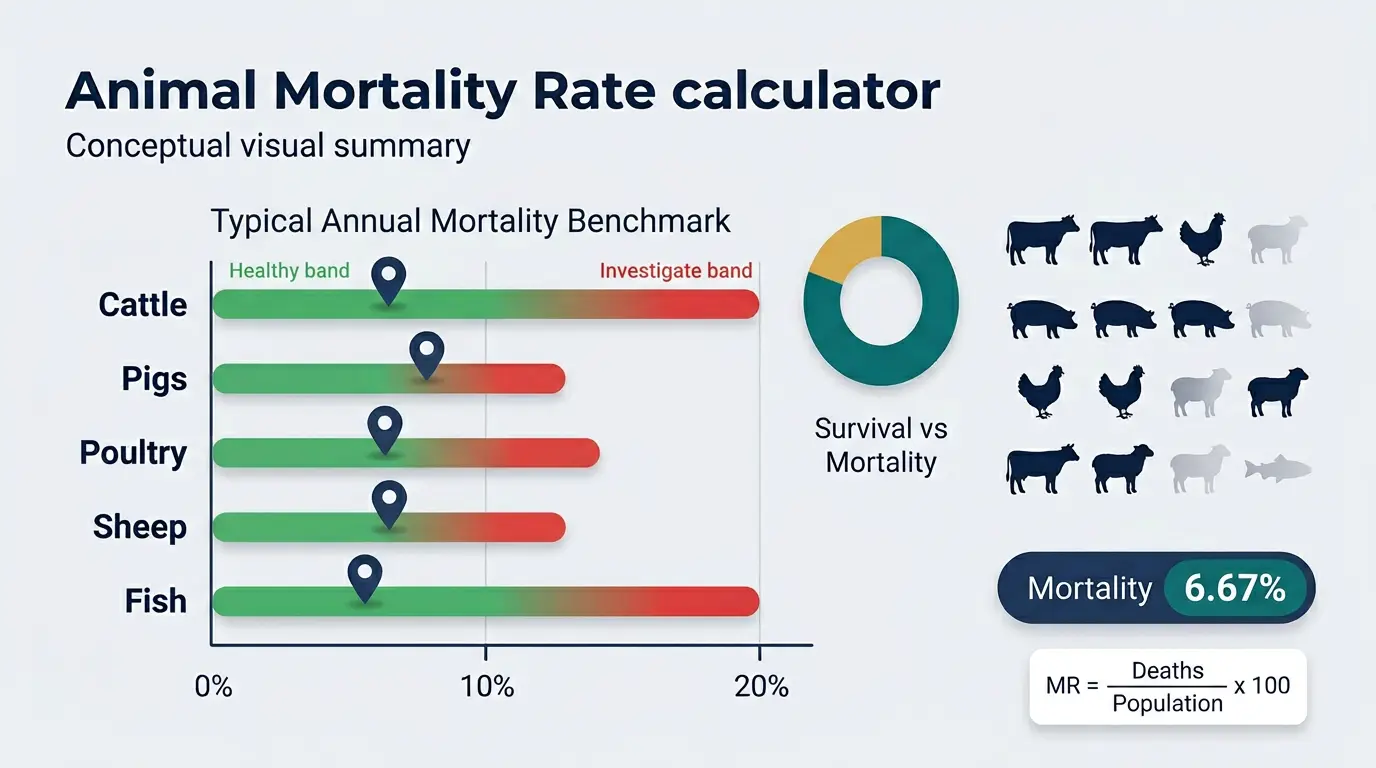
- Benchmarks vary by species: 1–3% for adult beef cattle, 3–6% for dairy, 5–10% for pre-weaning calves
- Survival rate = 100% − mortality rate; both are reported for welfare and epidemiology reporting
Creators
Dharmendra SinghReviewers
Creators
Dharmendra SinghReviewers
Formula
Mortality Rate = (Deaths / Population at Risk) × 100
Where:
- MR=Mortality rate(%)
- D=Number of deaths in the period
- N=Population at risk (opening stock + births)
Worked Examples
Cattle Herd — Annual Assessment
A cattle herd with 200 head at the start of the year, 25 calves born, 30 sold, and 180 remaining at year end
- 1Population at risk = Opening + Births = 200 + 25 = 225
- 2Deaths = Opening + Births − Sold − Closing = 200 + 25 − 30 − 180 = 15
- 3Mortality rate = (15 / 225) × 100 = 6.67%
- 4Survival rate = 100 − 6.67 = 93.33%
Poultry Flock — Quarterly Review
A poultry operation with 5,000 birds at start, 0 added, 200 sold, and 4,500 remaining after 3 months
- 1Population at risk = 5,000 + 0 = 5,000
- 2Deaths = 5,000 + 0 − 200 − 4,500 = 300
- 3Mortality rate = (300 / 5,000) × 100 = 6.00%
- 4Survival rate = 94.00%
Sheep Flock — Lambing Season
150 ewes with 120 lambs born, 10 sold, 245 at period end
- 1Population at risk = 150 + 120 = 270
- 2Deaths = 150 + 120 − 10 − 245 = 15
- 3Mortality rate = (15 / 270) × 100 = 5.56%
- 4Survival rate = 94.44%
Bovine Respiratory Disease — Case Fatality Rate
Of 50 calves that fell sick with BRD during an outbreak, 5 died. Use Disease (case) mortality mode.
- 1Case mortality = (Deaths from disease ÷ Disease cases) × 100
- 2Case mortality = (5 / 50) × 100 = 10%
Introduction
The Animal Mortality Rate Calculator computes death rates in animal populations over a specified time period. This metric is critical in veterinary epidemiology for disease surveillance, herd management, and conservation biology. For related livestock management tools, see our cattle per acre calculator and feed conversion ratio calculator.
How the Calculation Works
The mortality rate formula requires four pieces of data that are standard in any livestock record-keeping system. The key insight is that deaths are inferred from the difference between animals that should be present and animals that are actually present.
- Opening stock:
Number of animals alive at the start of the period
- Births/additions:
Animals born or purchased during the period
- Sold/removed:
Animals sold, transferred, or culled (alive) during the period
- Closing stock:
Animals alive at the end of the period
Deaths = Opening + Births − Sold − Closing
Mortality Rate = (Deaths / (Opening + Births)) × 100
Always distinguish between deaths and culls. Animals intentionally culled (for market, age, or management) should be counted as 'sold/removed', not as mortality. Only unintended deaths count toward mortality rate.
Typical Mortality Rates by Species
Acceptable mortality rates vary widely across species, production systems, and age groups. Knowing the benchmark for your species helps you identify whether your herd or flock is performing within normal parameters.
- Beef cattle (adult):
1–3% annually — rates above 5% indicate serious health or management issues
- Dairy cows:
3–6% annually — higher due to metabolic stress from milk production
- Calves (pre-weaning):
5–10% — neonatal disease and scours are primary causes
- Pigs (grower-finisher):
3–5% — respiratory disease is the leading cause
- Piglets (pre-weaning):
10–15% — crushing and chilling are major risk factors
- Poultry (broilers):
3–5% per flock cycle — varies significantly by housing system
- Sheep (adult):
3–7% annually — parasitism and predation are common causes
- Goats:
4–8% annually — similar to sheep, with added risk from pneumonia
- Aquaculture (fish):
5–20% — highly variable by species and water conditions
| Species / Stage | Typical Mortality | Investigate Above | Leading Causes |
|---|---|---|---|
| Beef cattle (adult) | 1–3% per year | 5% | Disease, accidents, predation |
| Dairy cows | 3–6% per year | 8% | Metabolic, mastitis, lameness |
| Calves (pre-weaning) | 5–10% | 10% | Scours, pneumonia, dystocia |
| Pigs (grower-finisher) | 3–5% | 6% | Respiratory disease, PRRS |
| Piglets (pre-weaning) | 10–15% | 18% | Crushing, chilling, scours |
| Poultry (broilers) | 3–5% per cycle | 6% | Sudden death, leg/cardio issues |
| Sheep (adult) | 3–7% per year | 8% | Parasitism, predation, foot rot |
| Goats | 4–8% per year | 10% | Pneumonia, parasites, kidding loss |
| Aquaculture (fish) | 5–20% | Species-specific | Disease, water quality, oxygen |
Benchmarks are general guidelines. Always compare against historical performance for your own farm — a steady 4% can be normal in one system and alarming in another.
Common Causes of Livestock Mortality
Understanding the primary causes of death in your population is essential for reducing mortality rates. Causes vary by species, age group, season, and management system.
- Infectious disease:
Bacterial, viral, and parasitic infections — often seasonal peaks
- Neonatal losses:
Dystocia (difficult birth), hypothermia, starvation, and navel infections
- Nutritional deficiency:
Mineral imbalances, insufficient feed, and toxic plants
- Metabolic disorders:
Milk fever (hypocalcemia), ketosis, bloat, and acidosis
- Predation:
Significant in sheep, goats, and free-range poultry systems
- Environmental stress:
Heat stroke, cold stress, flooding, and poor ventilation
- Trauma and accidents:
Equipment injuries, falls, fighting, and transport stress
Post-mortem examination (necropsy) of dead animals is the single most valuable tool for identifying causes of mortality. Even a basic field necropsy by a veterinarian can reveal whether deaths are from infection, toxicity, or management failures.
Strategies for Reducing Mortality
Effective mortality reduction requires a systematic approach combining prevention, early detection, and rapid response. Most farms can reduce mortality by 30–50% through improved management practices alone.
- Vaccination programs:
Implement species-appropriate vaccination schedules based on regional disease risks
- Biosecurity:
Control visitor access, quarantine new animals, and maintain hygiene at entry points
- Nutrition optimization:
Regular body condition scoring and mineral supplementation based on forage analysis
- Neonatal care protocols:
Ensure colostrum intake within 6 hours, maintain warm dry bedding, navel dipping
- Parasite management:
Fecal egg counts to guide targeted treatment rather than blanket dosing
- Record keeping:
Track individual animal health events to identify patterns and recurring problems
- Environmental management:
Adequate ventilation, stocking density, shelter, and clean water access
The most cost-effective intervention for most livestock operations is ensuring adequate colostrum intake for newborns. This single practice can reduce neonatal mortality by 50–70%.
Mortality Rate vs. Morbidity Rate
Mortality and morbidity are related but distinct epidemiological measures. Both are needed for a complete picture of herd health. A high morbidity rate with low mortality suggests treatable disease; low morbidity with high mortality suggests acute or peracute conditions.
- Mortality rate:
Proportion of animals that die — measures lethality
- Morbidity rate:
Proportion of animals that become sick — measures disease spread
- Case fatality rate:
Deaths ÷ sick animals × 100 — measures disease severity
- Incidence rate:
New cases per population per time period — measures disease occurrence
- Prevalence:
Proportion of population affected at a point in time — measures disease burden
Economic Impact of Mortality
Livestock mortality has direct and indirect economic consequences that extend well beyond the value of the dead animal itself. Understanding the full economic impact helps justify investments in health programs and biosecurity.
- Direct loss:
Market value of dead animals (replacement cost minus salvage value)
- Lost production:
Milk, eggs, wool, or offspring that the animal would have produced
- Treatment costs:
Veterinary fees, medications, and labor for treating sick animals before death
- Investigation costs:
Diagnostic testing, necropsy, and laboratory fees
- Genetic loss:
Irreplaceable breeding stock with superior genetics
- Regulatory impact:
Movement restrictions, quarantines, and reporting requirements for notifiable diseases
A common rule of thumb: the total economic impact of a livestock death is 3–5 times the animal's market value when you include lost production, replacement costs, and investigation expenses.
Common Mistakes to Avoid
Mortality calculations go wrong in predictable ways. Avoiding these errors keeps your rate comparable to industry benchmarks and useful for decision-making.
- Counting culls as deaths:
animals sent to market or culled alive belong in 'sold/removed', not in deaths
- Forgetting purchased animals:
animals bought during the period must go into 'births / new animals', or deaths will be overstated
- Mismatched time periods:
an annual mortality rate cannot be compared to a quarterly one — always state the period
- Using closing stock as the denominator:
the correct denominator is population at risk (opening + births), not the survivors at the end
- Ignoring stillbirths separately:
born-dead animals are perinatal losses; tracking them in a separate metric prevents distortion of adult mortality
Sanity check: Deaths = Opening + Births − Sold − Closing must be ≥ 0. If you get a negative number, your inventory is inconsistent.
Animal Mortality Glossary
Key terms used in livestock and veterinary mortality reporting:
| Term | Definition |
|---|---|
| Mortality rate | Deaths in a period ÷ population at risk × 100 — expressed as a percentage. |
| Survival rate | 100% − mortality rate; the proportion of the population at risk that is still alive at period end. |
| Population at risk | Animals that could have died during the period — typically opening stock + births/additions. |
| Case fatality rate (CFR) | Deaths from a specific disease ÷ animals that became sick with it × 100. |
| Morbidity rate | Proportion of animals that became sick (any cause) during the period. |
| Perinatal / neonatal mortality | Deaths around birth or in the first days/weeks of life — usually tracked separately. |
| Cull / culling | Intentional removal (slaughter or sale) of an animal alive — not counted as mortality. |
Quick Reference Card
Animal Mortality Rate Calculator — Quick Reference
Quick reference • Animal Mortality Rate Calculator
Mortality % = (Opening + Births − Sold − Closing) ÷ (Opening + Births) × 100Valid range: All counts ≥ 0; total population at risk > 0; recessive ≤ total
Common Values
⚠ Watch Out
- •Only unintended losses count — culls and sales are not deaths
- •Population at risk is opening + births, NOT closing stock
- •Negative deaths means inventory is inconsistent — review counts
- •Compare like with like: annual vs annual, quarterly vs quarterly
Pro Tips
- →Track by group (barn, pasture, age) to expose hot spots a farm-wide rate hides
- →Run a basic necropsy on every loss — it pays for itself within a few cycles
- →Colostrum within 6 hours of birth is the single biggest neonatal-mortality lever
FAQs
How do I calculate animal mortality rate?
First determine the number of deaths: Deaths = Opening Stock + Births − Animals Sold − Closing Stock. Then calculate: Mortality Rate = (Deaths ÷ (Opening Stock + Births)) × 100. For example, if you start with 200 cattle, have 25 calves born, sell 30, and end with 180, then deaths = 200 + 25 − 30 − 180 = 15, and mortality rate = 15/225 × 100 = 6.67%.
What is a normal mortality rate for cattle?
For adult beef cattle, 1–3% annually is normal. Dairy cattle typically run 3–6% due to metabolic stress. Calves (pre-weaning) have higher rates at 5–10%. Rates consistently above these ranges indicate health or management problems that should be investigated.
What is the difference between mortality rate and case fatality rate?
Mortality rate measures deaths as a proportion of the total population at risk. Case fatality rate (CFR) measures deaths as a proportion of animals that became sick with a specific disease. For example, if 50 out of 500 cattle get BRD and 5 die: mortality rate = 5/500 = 1%, but CFR = 5/50 = 10%.
How often should I calculate mortality rates?
Monthly calculation is ideal for intensive operations (dairy, poultry, feedlots). Quarterly reviews work well for extensive grazing operations. Annual calculations are the minimum for any livestock enterprise. Calculate immediately if you notice an unusual cluster of deaths.
Why is my calculated death count negative?
A negative death count means your closing stock plus sold animals exceeds your opening stock plus births. This usually means:
- 1you forgot to count some purchased/transferred-in animals in the 'births' field,
- 2closing stock was miscounted, or
- 3animals from another group were mixed in
Review your records carefully.
Should I include stillbirths in the mortality calculation?
It depends on your definition period. Stillbirths (born dead) are typically tracked separately as perinatal mortality. For standard herd mortality calculations, only include animals that were born alive. However, for reproductive performance analysis, stillbirths are a critical metric to track separately.
How does season affect livestock mortality?
Mortality rates often show seasonal patterns: winter peaks from cold stress, pneumonia, and nutritional deficiency; spring peaks from dystocia and neonatal losses; summer peaks from heat stress and parasites; and autumn peaks from toxicity (acorns, certain plants). Knowing your seasonal pattern helps target preventive measures.
What is the difference between mortality rate and survival rate?
They are complements: survival rate = 100% − mortality rate. If 6.67% of your herd dies in a year, 93.33% survives. Both metrics are reported by this calculator because some audiences (welfare, conservation) prefer survival framing while veterinary epidemiology typically reports mortality.
Why isn't 'culled' counted as a death?
Mortality rate measures unintended losses — animals that died despite your management. Culled animals were intentionally removed alive (sold for market, age, low production, or breed selection) and represent a management decision, not a failure. Lumping them in inflates your mortality rate and hides real health problems.
How do I track mortality across multiple barns or pastures?
Calculate mortality separately for each management group, then weight by population size to get a herd-level rate. Group-level rates often reveal hot spots (a sick pen, a problem pasture, a poor calving group) that a single farm-wide number would hide.
How is this different from human mortality rate calculations?
The structure is the same — deaths divided by population at risk × 100 — but human epidemiology usually works from a fixed enrollment cohort and uses person-time at risk. Livestock calculations infer deaths from inventory changes (opening + births − sold − closing) because deaths are not always observed at the moment they occur.