Last updated: May 31, 2026
Annealing Temperature Calculator

Creators
Dharmendra SinghReviewers
Creators
Dharmendra SinghReviewers
Quick Answer
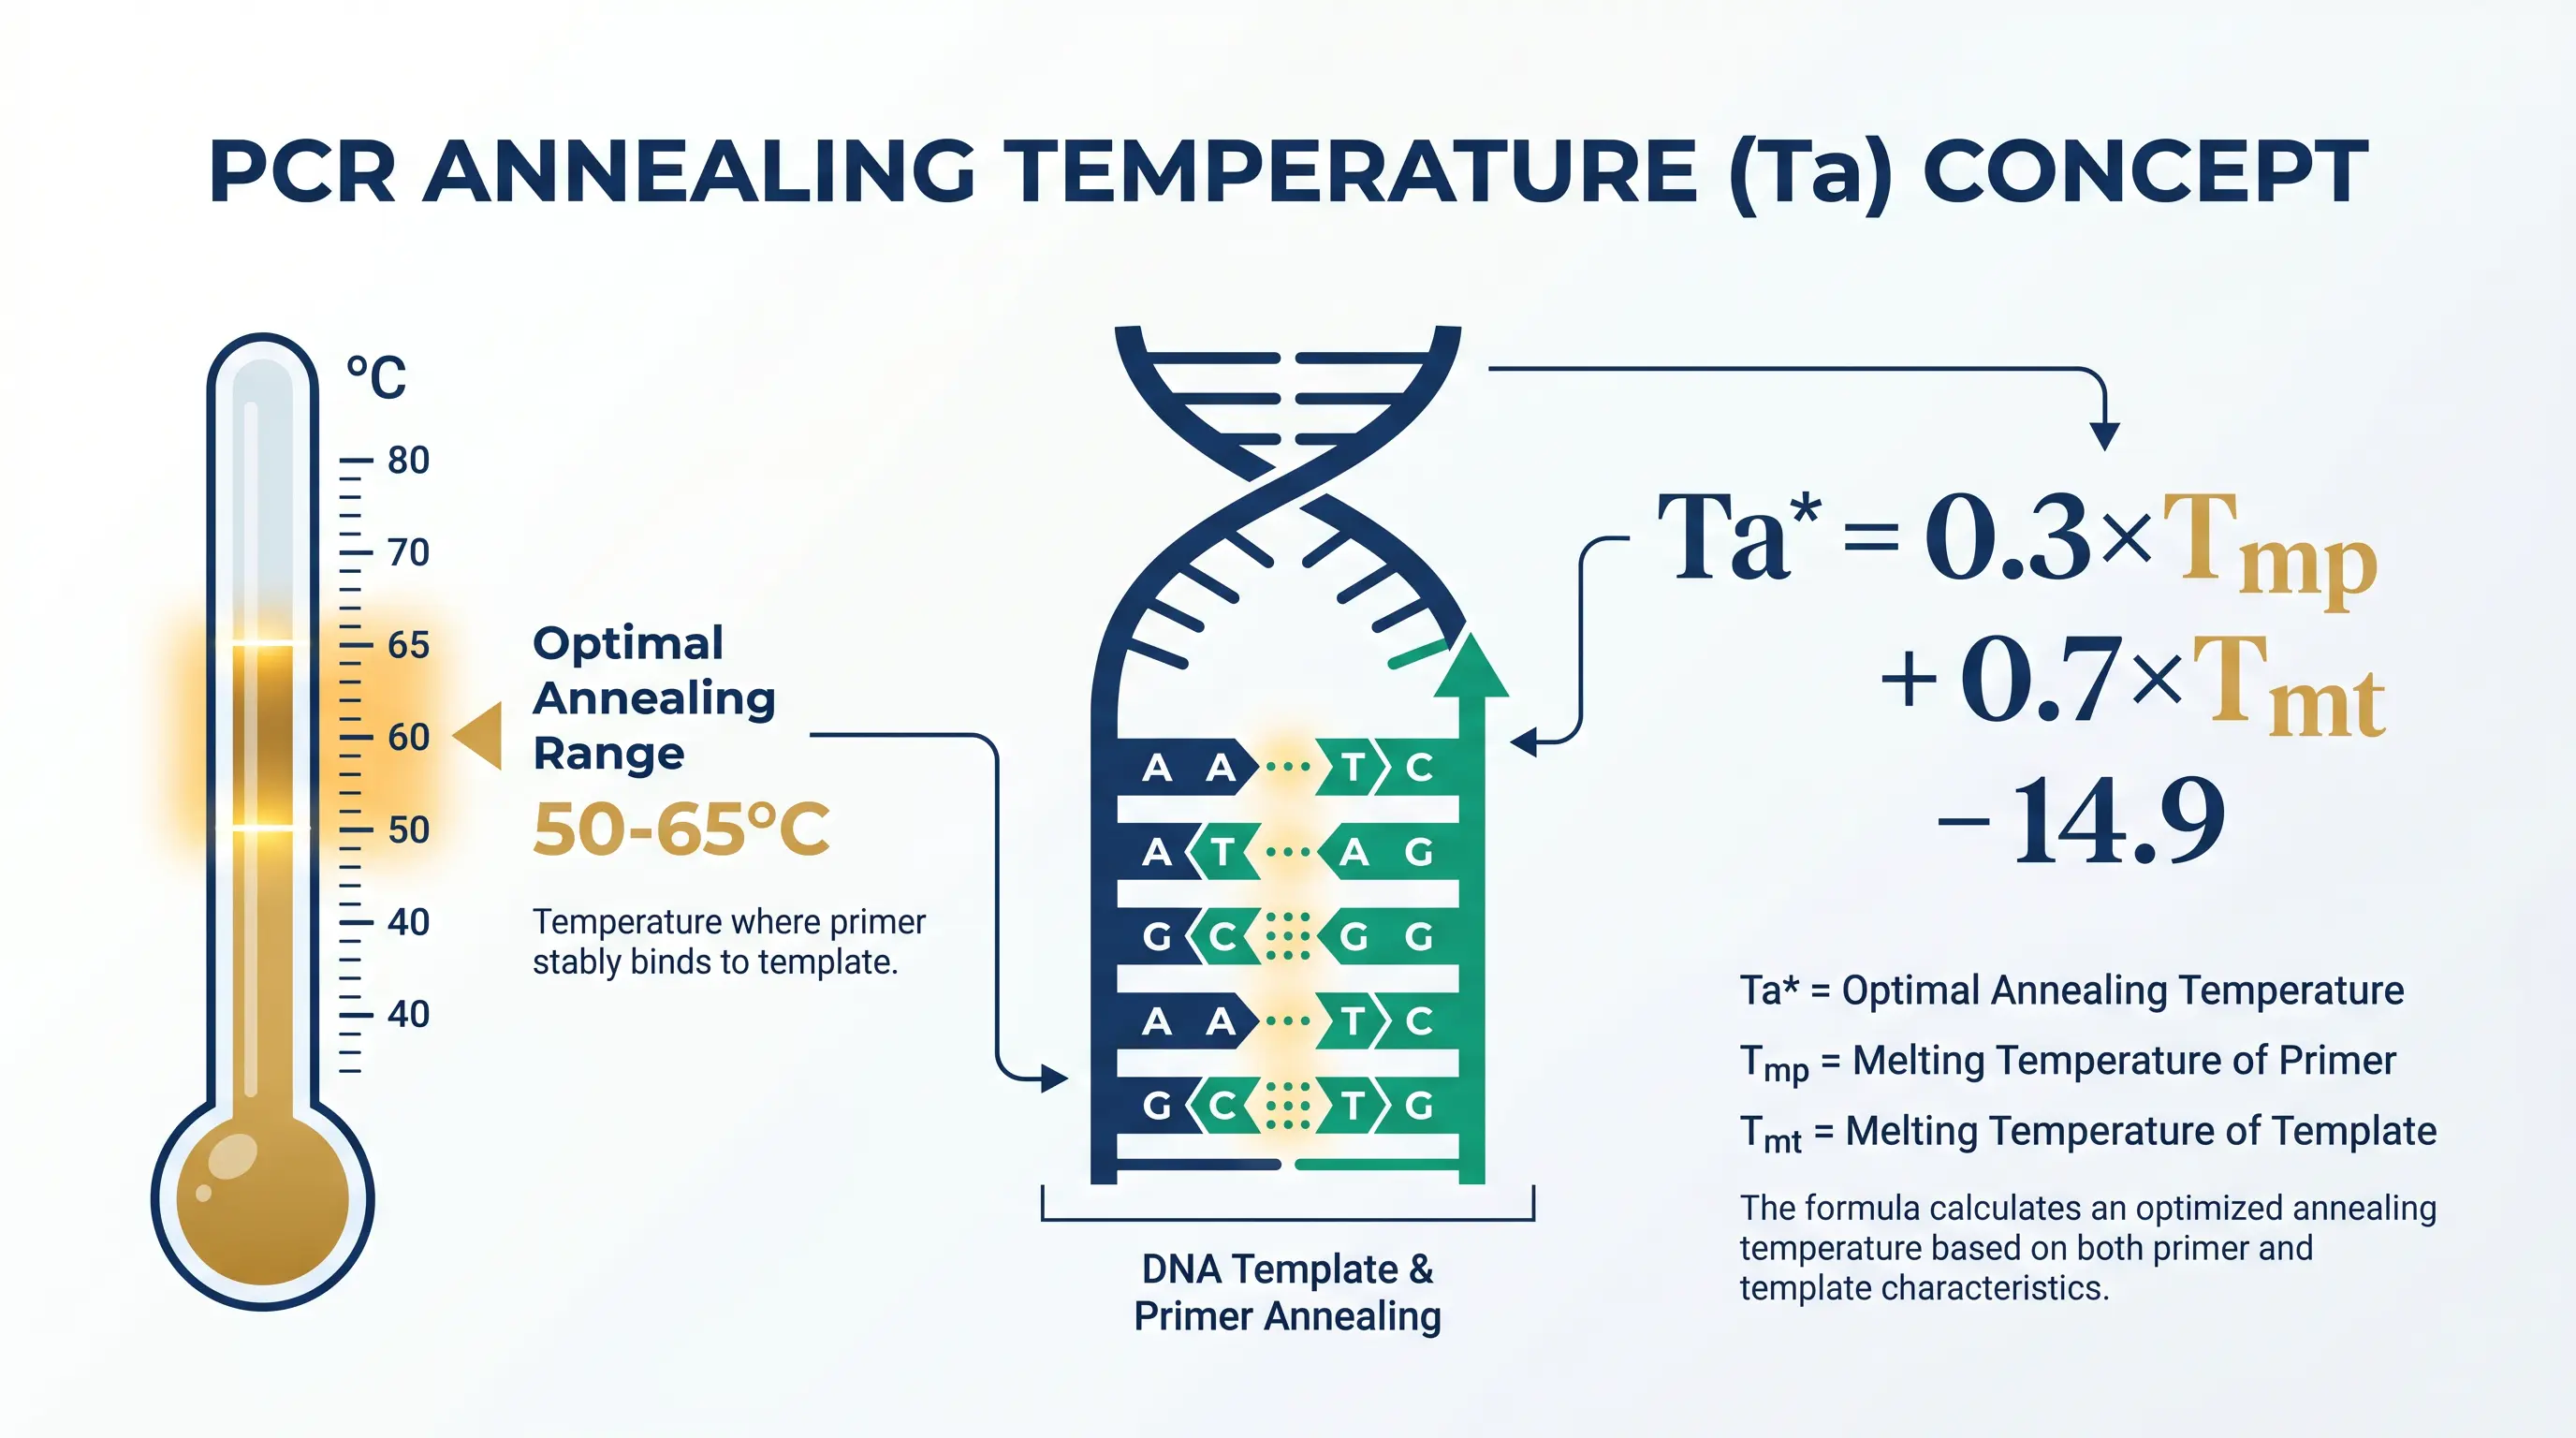
The optimal PCR annealing temperature is calculated using Ta* = 0.3 × Tmp + 0.7 × Tmt - 14.9 (Rychlik et al., 1990), where Tmp is the melting temperature of the less stable primer and Tmt is the target DNA melting temperature. This free online calculator instantly computes Ta* from your Tm values, with support for gradient PCR ranges and 19 polymerase kits.
The PCR annealing temperature equals 0.3 times the primer melting temperature plus 0.7 times the target melting temperature minus 14.9 degrees Celsius, based on the Rychlik formula from 1990.
Key Takeaways
- The optimal annealing temperature (Ta*) is calculated using Ta* = 0.3 × Tmp + 0.7 × Tmt - 14.9, derived from Rychlik et al. (1990)
- Always use the melting temperature of the LESS stable primer (lower Tm) — this ensures both primers bind efficiently
- The calculated Ta is a starting point — validate with a gradient PCR (±5°C) for critical experiments
- Too high = no product; too low = non-specific bands and primer dimers
- Formula assumes standard buffer conditions (50 mM KCl, 1.5 mM MgCl₂) — adjust ±2-5°C for modified buffers
Creators
Dharmendra SinghReviewers
Creators
Dharmendra SinghReviewers
Formula
Ta* = 0.3 × Tmp + 0.7 × Tmt - 14.9
Where:
- T_a^*=Optimal Annealing Temperature(°C)
- T_{mp}=Primer Melting Temperature (less stable primer)(°C)
- T_{mt}=Target DNA Melting Temperature(°C)
Worked Examples
Cat Gene PCR Example
Amplification of a ~2 kb cat gene sequence using two primers with different melting temperatures.
- 1Identify the less stable primer: Primer 1 (Tmp = 65.5°C) vs Primer 2 (Tmp = 74.6°C) → Use 65.5°C
- 2Apply the formula: Ta* = 0.3 × 65.5 + 0.7 × 88.6 - 14.9
- 3Calculate: Ta* = 19.65 + 62.02 - 14.9
- 4Result: Ta* = 66.77°C
qPCR Optimization — Human GAPDH
Designing a qPCR assay for the housekeeping gene GAPDH with primers optimized for 60°C annealing.
- 1Primer Tm values: Forward = 59.2°C, Reverse = 61.8°C → Use lower: 59.2°C
- 2Target Tm from amplicon (85 bp, 52% GC): Tmt = 78.4°C
- 3Apply formula: Ta* = 0.3 × 59.2 + 0.7 × 78.4 - 14.9
- 4Calculate: Ta* = 17.76 + 54.88 - 14.9
- 5Result: Ta* = 57.74°C — within optimal qPCR range (55-62°C)
High-GC Primer Pair — Promoter Region
Amplifying a GC-rich promoter region (68% GC) requiring DMSO supplementation.
- 1Both primers have high Tm: 72.1°C and 75.4°C → Use lower: 72.1°C
- 2Target Tm is high due to GC-rich region: Tmt = 92.3°C
- 3Apply formula: Ta* = 0.3 × 72.1 + 0.7 × 92.3 - 14.9
- 4Calculate: Ta* = 21.63 + 64.61 - 14.9
- 5Result: Ta* = 71.34°C — consider two-step PCR at 72°C
- 6With 5% DMSO: adjust Ta down by ~3°C → effective Ta ≈ 68°C
Introduction
The annealing temperature is one of the most critical parameters in PCR (Polymerase Chain Reaction). Setting it correctly determines whether your primers bind specifically to the target DNA or produce non-specific products. This calculator uses the empirically-derived formula from Rychlik et al. (1990) to determine the optimal annealing temperature based on your primer and target melting temperatures. Whether you're optimizing a standard PCR, troubleshooting failed reactions, or setting up gradient experiments, this tool provides an accurate starting point grounded in thermodynamic principles.
What is Annealing Temperature?
The annealing temperature (Ta) is the temperature during a PCR thermal cycle at which primers hybridize to their complementary sequences on the template DNA. It occurs during the second step of each PCR cycle, after denaturation (strand separation) and before elongation (DNA synthesis). The annealing temperature directly controls the stringency of primer binding — it determines how perfectly matched a primer must be to its target to form a stable duplex. This single parameter has more impact on PCR success than any other variable in most experiments.
Too high → primers won't bind, no PCR product (false negative)
Too low → primers bind non-specifically, multiple unwanted products (false positive bands)
Optimal → primers bind only to the intended target sequence with maximum efficiency
Typically 3-5°C below the primer Tm for standard PCR conditions
Should be optimized experimentally using gradient PCR for critical applications
PCR Thermal Cycle Steps
A standard PCR reaction consists of 25-35 repetitions of three temperature steps. Each cycle doubles the amount of target DNA, resulting in exponential amplification — learn more about this with our cell doubling time calculator. Understanding these steps helps explain why annealing temperature is so critical — it's the only step where primer specificity is determined.
- 1
Denaturation (94-98°C, 20-30 sec): Double-stranded DNA separates into single strands. Higher temperatures are needed for GC-rich templates. Hot-start polymerases require an initial 2-5 min activation at 95°C.
- 2
Annealing (50-65°C, 20-40 sec): Primers bind to complementary sequences on template DNA. This is the step controlled by our calculator. The temperature must be low enough for primers to bind but high enough to prevent mismatches.
- 3
Elongation (72-80°C, 30 sec per kb): DNA polymerase extends primers, synthesizing new DNA strands. Extension time depends on amplicon length — typically 1 minute per kilobase for Taq, 30 seconds per kb for high-fidelity polymerases.
Understanding the Formula
The formula Ta* = 0.3 × Tmp + 0.7 × Tmt - 14.9 was derived empirically by Rychlik, Spencer, and Rhoads in 1990 through systematic optimization of PCR conditions across multiple primer-template systems. The coefficients (0.3 and 0.7) reflect the relative contributions of primer stability and target stability to the overall annealing efficiency. The constant 14.9 is an empirical correction factor determined through extensive experimental optimization. This formula accounts for the fact that target DNA stability contributes more to annealing efficiency than primer stability alone — because the target provides the scaffold for primer binding.
This formula assumes standard PCR buffer conditions (50 mM KCl, 1.5 mM MgCl₂). Different buffer compositions may require adjustment. High-fidelity buffers, GC-rich enhancers, or DMSO supplementation can shift the optimal Ta by 2-5°C.
Factors That Affect Annealing Temperature
While the Rychlik formula provides an excellent starting point, several additional factors influence the true optimal annealing temperature in practice. Understanding these factors helps you interpret calculator results and make informed adjustments.
- Primer length:
Longer primers (>25 bp) have higher Tm values and can tolerate higher annealing temperatures, improving specificity
- GC content:
Primers with high GC content (>60%) form stronger bonds and may require higher Ta to prevent non-specific binding
- Mismatch tolerance:
Lower annealing temperatures allow primers to bind despite 1-2 base mismatches — useful for degenerate primers but problematic for specificity
- Salt concentration:
Higher Mg²⁺ or KCl concentrations stabilize primer-template duplexes, effectively increasing the optimal Ta by 1-3°C
- DMSO/Betaine:
These additives destabilize secondary structures in GC-rich templates, often requiring a 2-5°C reduction in Ta
- Primer concentration:
Higher primer concentrations (>500 nM) can promote non-specific binding, requiring higher Ta to maintain specificity
- Template complexity:
Genomic DNA (complex) vs plasmid (simple) — complex templates have more potential non-specific binding sites
How to Optimize Your PCR Annealing Temperature
Finding the perfect annealing temperature often requires experimental validation beyond calculation alone. The calculated value should be treated as the center point for optimization, not the final answer. Here is a systematic approach used in professional molecular biology laboratories.
- 1
Calculate initial Ta using this calculator as your starting point — this gives you the thermodynamically predicted optimum
- 2
Run a temperature gradient PCR (±5°C from calculated Ta) to test 6-8 temperatures simultaneously on a gradient thermocycler
- 3
Analyze gel results: choose the temperature with the strongest specific band and no non-specific products
- 4
For difficult templates (GC-rich, repetitive, or long amplicons), consider touchdown PCR (start 10°C above Ta, decrease 1°C per cycle for 10 cycles)
- 5
For multiplex PCR, choose a Ta that works for all primer pairs — this often means designing primers with similar Tm values (within 2°C)
- 6
Document your optimized conditions for reproducibility — include exact buffer, primer concentrations, and cycling parameters
- 7
Re-optimize when changing polymerase brands, buffer lots, or template sources
The constant 14.9 works only when you use temperatures measured in Celsius. For Fahrenheit, the constant is 58.82, and for Kelvin, it's 288.05 — learn how to convert between those units with our temperature conversion calculator.
Two-Step PCR: When Annealing Equals Extension
In two-step PCR, the annealing and extension steps are combined into a single step at 68-72°C. This is possible when primers have high Tm values (>68°C) and the polymerase has sufficient activity at the annealing temperature. Two-step PCR reduces cycle time by ~30% and can improve yields for primers with high Tm values. Many high-fidelity polymerases (like Phusion or Q5) are specifically designed for two-step protocols. You may need to verify temperature units — use our temperature conversion calculator if needed.
Requires primers with Tm ≥ 68°C (use Nearest-Neighbor calculation method)
Combined annealing/extension at 72°C (standard) or 68°C (shorter amplicons)
Reduces non-specific amplification by maintaining high stringency throughout
Shorter total protocol time — ideal for high-throughput applications
Not suitable for primers with Tm < 65°C or highly complex templates
Troubleshooting Common PCR Problems
Most PCR failures are related to incorrect annealing temperature. Here are the most common issues and their solutions, organized by the symptom you observe on your gel or in your qPCR results. For quantitative analysis of your PCR products, consider using our DNA concentration calculator to verify amplicon yield:
- No product (empty lane):
Lower Ta by 3-5°C, increase annealing time to 45-60 sec, verify primer integrity by running on a gel, check template quality by spectrophotometry (A260/A280 should be 1.8-2.0)
- Multiple bands (non-specific):
Increase Ta by 2-5°C, reduce primer concentration to 200 nM, use touchdown PCR, add 3-5% DMSO for GC-rich regions
- Primer dimers (low molecular weight band):
Increase Ta, redesign primers to avoid 3' complementarity (check with software like Primer3), reduce primer concentration, use hot-start polymerase
- Weak bands (low yield):
Optimize Ta (±3°C gradient), increase cycle number to 35, add PCR enhancers (DMSO, betaine, BSA), increase template concentration
- Smearing (degradation):
Check template quality, reduce cycle number, lower denaturation temperature to 94°C, use fresh dNTPs
- Inconsistent results between replicates:
Ensure proper mixing, use master mixes, calibrate thermocycler block temperature
When to Use This Calculator
This annealing temperature calculator is essential for any PCR-based experiment. Here are the most common scenarios where calculating the optimal Ta gives significantly better results than guessing or using generic temperatures:
- Standard PCR:
Routine gene amplification from genomic DNA, cDNA, or plasmid templates — the most common use case
- qPCR / Real-time PCR:
Requires precise Ta for single melt peaks and 90-110% efficiency — use with our qPCR efficiency calculator
- RT-PCR:
Reverse transcription PCR for gene expression analysis — same thermodynamic principles apply to the PCR amplification step
- Multiplex PCR:
When amplifying multiple targets simultaneously, calculate Ta for each primer pair and use the average — all primers should have Tm within 2°C
- Colony PCR:
Quick screening of bacterial colonies — use slightly lower Ta (−2°C) since crude lysate conditions reduce primer binding efficiency
- Cloning and ligation verification:
After cloning with our ligation calculator, verify insert presence by PCR with vector-specific primers
- Site-directed mutagenesis:
Mutagenic primers often have mismatches — calculate Ta based on the MATCHED portion only
- DNA copy number quantification:
Combine with our DNA copy number calculator for absolute quantification workflows
Annealing Temperature Methods Compared
Several methods exist for determining annealing temperature. The Rychlik formula used by this calculator is the most widely validated, but understanding alternatives helps you choose the right approach for your experiment. For accurate results, ensure your temperature values are in Celsius — use our temperature conversion calculator if needed.
| Method | Formula / Approach | Accuracy | Best For |
|---|---|---|---|
| 5-Degree Rule | Ta = Tm − 5°C | Low (±5°C error) | Quick estimate, simple primers |
| Rychlik Formula (this calculator) | Ta* = 0.3×Tmp + 0.7×Tmt − 14.9 | High (±2°C) | Standard PCR, most applications |
| Nearest-Neighbor (Santa Lucia) | Thermodynamic ΔG calculation | Highest (±1°C) | Critical experiments, primer design software |
| Empirical Gradient | Test 6-8 temperatures experimentally | Definitive | Publication-quality optimization |
| Touchdown PCR | Start high, decrease 1°C/cycle | Self-optimizing | Unknown targets, complex templates |
| Two-Step Protocol | Anneal + extend at 68-72°C | High for high-Tm primers | Primers with Tm > 68°C |
Common Annealing Temperature Values
The following reference table provides typical annealing temperature ranges for different primer types and PCR conditions. Use these as sanity checks — if your calculated Ta falls outside the expected range for your primer type, double-check your input values. For protein-level downstream analysis after PCR, see our protein concentration calculator.
| Primer Type | Typical Tm Range | Recommended Ta Range | Notes |
|---|---|---|---|
| Short primers (18-20 bp) | 50-58°C | 45-55°C | Use for simple templates only |
| Standard primers (20-25 bp) | 55-65°C | 52-62°C | Most common in research labs |
| Long primers (>25 bp) | 62-72°C | 58-68°C | Better specificity, higher Ta |
| GC-rich primers (>60% GC) | 65-75°C | 60-70°C | May need DMSO/betaine |
| AT-rich primers (<40% GC) | 48-55°C | 45-52°C | Lower stringency needed |
| Degenerate primers | 45-60°C | 42-55°C | Use lowest Tm variant |
| Mutagenic primers | Variable | Tm of matched region − 5°C | Ignore mismatch bases for Tm |
| Sequencing primers (M13, T7) | 50-55°C | 50-55°C | Well-characterized, use standard Ta |
Common Mistakes to Avoid
Even experienced researchers make these errors when setting up PCR annealing conditions. Avoiding these pitfalls will save hours of troubleshooting and wasted reagents:
Using the HIGHER primer Tm instead of the lower one: Always use the less stable primer's Tm (the lower value). Using the higher one means the weaker primer won't bind efficiently, causing asymmetric or failed amplification
- Confusing Tm with Ta:
The melting temperature (Tm) is a property of the primer sequence — the annealing temperature (Ta) is what you set on the thermocycler. Ta should always be LOWER than Tm
- Mixing Tm calculation methods:
Different software uses different algorithms (Wallace Rule, Basic, Nearest-Neighbor). Using Tm values from different methods for your two primers will give inconsistent results — always use the same method for both
- Ignoring salt concentration effects:
The Rychlik formula assumes standard buffer (50 mM KCl, 1.5 mM MgCl₂). If you're using high-fidelity buffers or extra MgCl₂, your actual optimal Ta may be 2-5°C higher than calculated
- Not accounting for DMSO or betaine:
These additives lower the effective Tm by 0.5-0.6°C per 1% DMSO. If you add 5% DMSO, subtract ~3°C from your calculated Ta
- Skipping gradient optimization:
The calculated Ta is a starting point, not a final answer. For critical experiments (publications, diagnostics), always validate with a 6-point gradient PCR
- Using the same Ta for all primer pairs:
Each primer pair has its own optimal Ta. Don't assume 55°C or 60°C works for everything — calculate individually
- Forgetting to account for primer dimers:
If you see primer dimers, increasing Ta by 3°C is often more effective than redesigning primers — it reduces the stability of short complementary interactions between primers
PCR & Annealing Temperature Glossary
Key terms used in PCR annealing temperature optimization. Understanding these definitions will help you interpret calculator results and troubleshoot experiments:
| Term | Definition |
|---|---|
| Annealing Temperature (Ta) | The temperature set on the thermocycler during the primer-binding step of PCR. Typically 3-5°C below primer Tm. |
| Melting Temperature (Tm) | The temperature at which 50% of primer-template duplexes dissociate into single strands. A thermodynamic property of the sequence. |
| PCR (Polymerase Chain Reaction) | A technique to exponentially amplify specific DNA sequences through repeated thermal cycles of denaturation, annealing, and extension. |
| Primer | A short synthetic oligonucleotide (18-30 bases) that binds complementary DNA and provides a starting point for DNA polymerase. |
| Denaturation | The first PCR step (94-98°C) where double-stranded DNA separates into single strands by breaking hydrogen bonds. |
| Extension/Elongation | The third PCR step (68-72°C) where DNA polymerase synthesizes new DNA strands complementary to the template. |
| Specificity | The ability of primers to bind ONLY to the intended target sequence, avoiding non-specific amplification. |
| Stringency | The degree to which reaction conditions favor perfectly matched primer-template binding over mismatched binding. Higher Ta = higher stringency. |
| Touchdown PCR | A technique starting 5-10°C above calculated Ta and decreasing 1°C per cycle, favoring specific binding in early cycles. |
| Gradient PCR | Running the same reaction at multiple annealing temperatures simultaneously using a gradient thermocycler block. |
| GC Content | The percentage of guanine (G) and cytosine (C) bases in a sequence. Higher GC = stronger bonds = higher Tm. |
| Nearest-Neighbor Method | The most accurate Tm calculation method, considering base-stacking interactions between adjacent nucleotides. |
| Hot-Start Polymerase | A modified DNA polymerase that is inactive at room temperature, preventing non-specific amplification during reaction setup. |
| Amplicon | The specific DNA fragment produced by PCR amplification, defined by the two primer binding sites. |
| Primer Dimer | A PCR artifact where primers bind to each other instead of the template, producing a short non-specific product (~30-60 bp). |
Quick Reference Card
PCR Annealing Temperature — Quick Reference
Quick reference • Annealing Temperature Calculator
Ta* = 0.3 × Tmp + 0.7 × Tmt - 14.9Valid range: 45°C – 72°C (standard PCR)
Common Values
⚠ Watch Out
- •Never use the higher-Tm primer — always use the LESS stable one
- •Formula only valid in Celsius — convert first if you have Fahrenheit values
- •Additives (DMSO, betaine) lower effective Ta by 2-5°C
- •Different Tm calculation methods give different results — be consistent
Pro Tips
- →Run a 6-point gradient (Ta ±5°C) on first attempt — saves days of troubleshooting
- →For qPCR, optimize for single melt peak AND 90-110% efficiency simultaneously
- →Primer dimers? Increase Ta by 3°C before redesigning primers
- →Hot-start polymerases allow higher Ta values and improve specificity
FAQs
What happens if the annealing temperature is too high?
If the annealing temperature is too high, primers cannot form stable hydrogen bonds with the template DNA. This results in no PCR product or very low yields. The primers need sufficient thermal energy reduction to hybridize — if the temperature remains too close to or above their melting temperature, the primer-template duplex is thermodynamically unstable. Try lowering the temperature by 3-5°C or extending the annealing time to 45-60 seconds.
What happens if the annealing temperature is too low?
An annealing temperature that's too low allows primers to bind to sequences that aren't perfectly complementary, causing non-specific amplification. You'll see multiple bands on a gel or a smear. At lower temperatures, even partial complementarity (as few as 8-10 bases) can allow primer binding, amplifying unintended targets. Increase the temperature by 2-3°C to improve specificity.
How do I calculate primer melting temperature (Tm)?
Several methods exist:
- 1Wallace Rule for short primers (<14 bp): Tm = 4(G+C) + 2(A+T)
- 2Basic formula: Tm = 64.9 + 41×(G+C-16.4)/(A+T+G+C)
- 3Nearest-Neighbor method (most accurate): considers base stacking interactions and is used by most primer design software like Primer3 and OligoAnalyzer
Always use the same method for both primers to ensure consistency.
Should I use the same annealing temperature for all PCR reactions?
No. Each primer pair and template combination has its own optimal annealing temperature. Factors like primer sequence, GC content, length, salt concentration, and template complexity all influence the ideal temperature. While 55°C or 60°C are common starting points, calculating the specific Ta for your primers will give significantly better results.
What is the difference between Tm and Ta?
Tm (Melting Temperature) is the temperature at which 50% of primer-template duplexes dissociate — it's a thermodynamic property of the primer sequence. Ta (Annealing Temperature) is the actual temperature you set on the thermocycler during PCR, typically 3-5°C below Tm. Our calculator determines the optimal Ta considering both primer and target stability.
Can I use this calculator for qPCR and RT-PCR?
Yes, the same thermodynamic principles apply. However, qPCR requires more stringent optimization because the reaction must be both specific (single melting peak) and efficient (90-110% amplification efficiency) across a wide dynamic range. For qPCR, I recommend testing a gradient from 55-65°C and selecting the temperature that provides the best specificity and efficiency balance.
Why do I use the less stable primer's Tm?
You use the lower Tm because both primers must bind efficiently at the annealing temperature. If you used the higher Tm, the less stable primer wouldn't bind well, leading to asymmetric amplification. By designing around the weaker primer, you ensure both primers anneal with similar efficiency.
What is touchdown PCR?
Touchdown PCR is a technique that starts with an annealing temperature 5-10°C above the calculated Ta and decreases by 0.5-1°C per cycle for the first 10-15 cycles, then continues at the calculated Ta for remaining cycles. This approach favors specific binding in early cycles (when competition from non-specific sites is highest) and ensures robust amplification in later cycles.
What is the 5 degree rule for annealing temperature?
The '5 degree rule' is a simplified guideline stating that the annealing temperature should be set 5°C below the primer's melting temperature (Ta = Tm - 5°C). While this works as a rough starting point for primers with Tm between 55-65°C, it's less accurate than the Rychlik formula (Ta* = 0.3×Tmp + 0.7×Tmt - 14.9) used in this calculator, which accounts for both primer AND target DNA stability. The 5-degree rule ignores target sequence effects and can lead to suboptimal results for complex templates or when primer and target Tm values differ significantly.
What is the optimal annealing temperature for Taq polymerase?
Taq polymerase works optimally when the annealing temperature is between 50-65°C for most primer pairs. Taq has partial activity at the annealing step (~25% at 55°C), which can cause non-specific extension. For primers with Tm > 68°C, you can use a two-step protocol (combined annealing/extension at 68-72°C). For standard Taq PCR with typical 20-25 bp primers, use this calculator to determine the specific optimal temperature rather than relying on a generic value. High-fidelity alternatives like Phusion or Q5 typically require 3-5°C higher annealing temperatures than Taq.
Is annealing temperature always 5 degrees below Tm?
No — the 'Tm minus 5°C' rule is an oversimplification that only works for a narrow range of conditions. The true optimal annealing temperature depends on both primer Tm AND target DNA Tm, plus buffer composition, primer concentration, and template complexity. Our calculator uses the Rychlik formula (Ta* = 0.3×Tmp + 0.7×Tmt - 14.9), which is empirically validated across dozens of primer-template systems. In practice, the optimal Ta can be anywhere from 3-15°C below the primer Tm depending on these variables. Always validate with a gradient PCR for critical experiments.