Last updated: June 24, 2026
qPCR Efficiency Calculator

Creators
Dharmendra SinghReviewers
Creators
Dharmendra SinghReviewers
Quick Answer
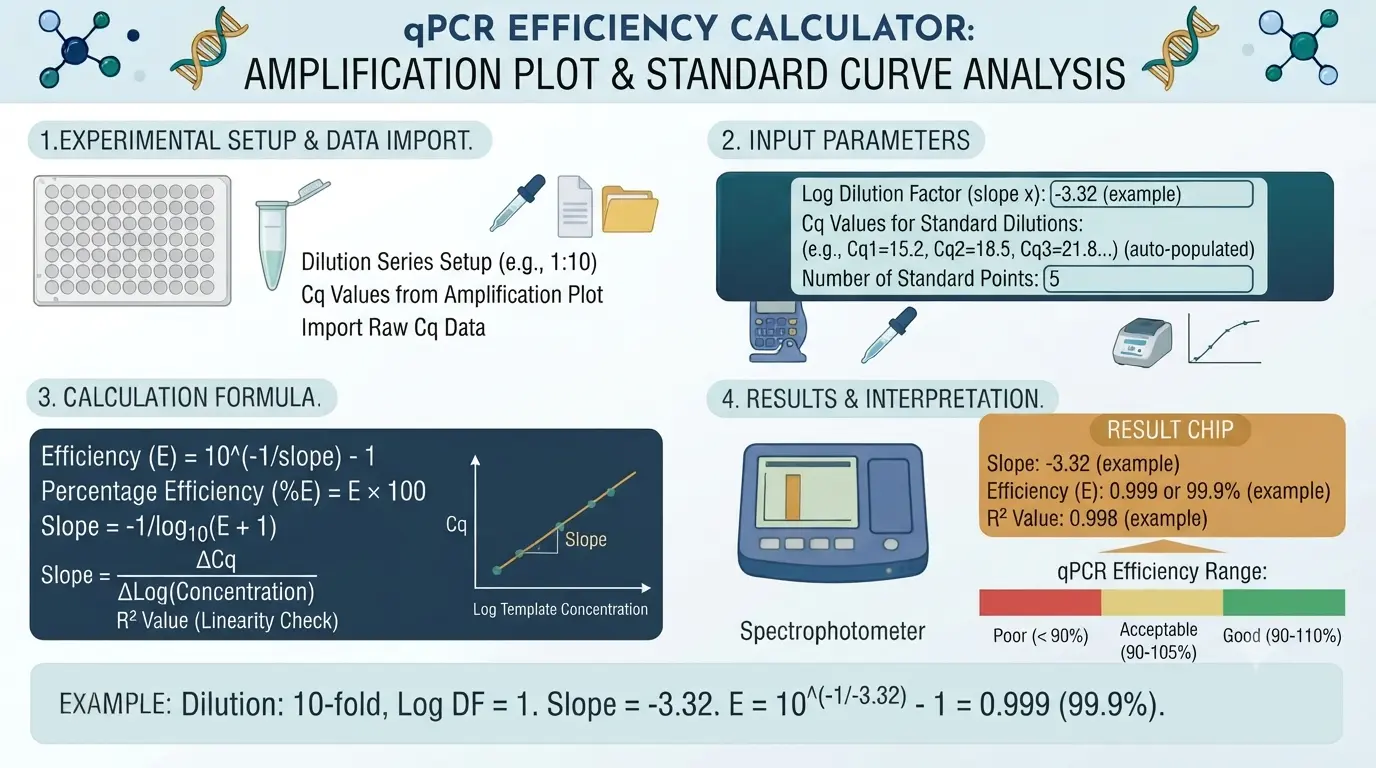
The qPCR Efficiency Calculator converts a real-time PCR standard-curve slope into amplification efficiency using E = (10^(−1/slope) − 1) × 100%. A slope of −3.322 equals 100% efficiency (amplification factor 2.0, perfect doubling). The MIQE-acceptable range is 90–110% (slopes −3.6 to −3.1). The tool also reports the amplification factor and the fold amplification across 10 cycles, and is essential for validating assays before relative quantification with the 2^−ΔΔCq method.
To calculate qPCR efficiency, use the formula efficiency equals 10 to the power of negative 1 over the slope, minus 1, times 100 percent. A slope of negative 3.32 gives 100 percent efficiency, meaning your target doubles every cycle.
Key Takeaways
- qPCR efficiency is calculated from the standard-curve slope: E = (10^(−1/slope) − 1) × 100%
- A slope of −3.322 gives 100% efficiency, meaning the target doubles every cycle (amplification factor 2.0)
- The MIQE-acceptable efficiency window is 90–110%, with slopes between −3.6 and −3.1
- Efficiency above 110% is usually an artefact (pipetting error, primer-dimers, or contamination), not a better reaction
- Matched, near-100% efficiencies are required for the 2^−ΔΔCq relative-quantification method to be valid
Creators
Dharmendra SinghReviewers
Creators
Dharmendra SinghReviewers
Formula
Efficiency = (10^(−1/slope) − 1) × 100%
Where:
- E=PCR amplification efficiency(%)
- slope=Slope of the standard curve (Cq vs log₁₀ template quantity)
- 10^(−1/slope)=Amplification factor (fold increase per cycle)(×)
Worked Examples
Ideal assay — slope of -3.32
A well-optimized qPCR assay produces a standard curve with a slope of -3.32 and R² of 0.999.
- 1Compute the amplification factor: 10^(−1/−3.32) = 10^0.3012 = 2.00
- 2Subtract 1: 2.00 − 1 = 1.00
- 3Multiply by 100%: efficiency = 100%
- 4Interpretation: the target doubles every cycle — a perfect assay
Sub-optimal assay — slope of -3.6
A steeper slope of -3.6 indicates the reaction is amplifying less than perfectly each cycle.
- 1Compute the amplification factor: 10^(−1/−3.6) = 10^0.2778 = 1.896
- 2Subtract 1: 1.896 − 1 = 0.896
- 3Multiply by 100%: efficiency ≈ 89.6%
- 4Interpretation: below the 90% threshold — optimize primers, MgCl₂, or remove inhibitors
Introduction
The qPCR Efficiency Calculator converts the slope of a real-time PCR standard curve into an amplification efficiency and an amplification factor. Enter the slope from your dilution-series regression (Cq vs log₁₀ template quantity) and it solves E = (10^(−1/slope) − 1) × 100% — the equation defined in the MIQE guidelines. A perfectly efficient reaction doubles its target every cycle (a 2.0× amplification factor, 100% efficiency). Validating efficiency is essential before any relative-quantification experiment, because the popular 2^−ΔΔCq method assumes 100% efficiency. For thermal-cycling setup, see our annealing temperature calculator; for template amounts, the DNA concentration calculator.
How the qPCR Efficiency Calculator Works
To measure efficiency you run a standard curve: a series of known template dilutions (typically 10-fold steps) amplified in the same run. Plotting the quantification cycle (Cq) against the log₁₀ of template quantity yields a straight line. The slope of that line encodes how much the product increases each cycle. The calculator inverts the slope to recover the per-cycle amplification factor, then expresses it as a percentage relative to perfect doubling.
Prepare a 10-fold dilution series of a known template
Amplify all dilutions in the same qPCR run, in replicates
Plot Cq (y-axis) against log₁₀ template quantity (x-axis)
Fit a linear regression and read off the slope
Enter the slope here to get efficiency and amplification factor
A 10-fold dilution series spanning at least 5 orders of magnitude gives the most reliable slope. Always run each dilution in duplicate or triplicate.
What the Slope Tells You
Because Cq increases as template decreases, the slope is always negative. The theoretical slope for a perfectly doubling reaction is −3.322 (because log₁₀(2) ≈ 0.301, and −1/0.301 ≈ −3.322). Slopes between −3.6 and −3.1 correspond to the acceptable 90–110% efficiency window. The table below maps common slopes to efficiency.
| Slope | Amplification factor | Efficiency | Verdict |
|---|---|---|---|
| −3.10 | 2.10× | 110.2% | Upper limit — check for inhibition/outliers |
| −3.32 | 2.00× | 100.0% | Ideal — perfect doubling |
| −3.45 | 1.95× | 94.9% | Good |
| −3.60 | 1.90× | 89.6% | Below 90% — optimize |
| −4.00 | 1.78× | 77.8% | Poor — re-design assay |
Efficiency outside 90–110% makes ΔΔCq quantification inaccurate. Either re-optimize the assay or switch to an efficiency-corrected model such as the Pfaffl method.
Efficiency vs. Amplification Factor
The amplification factor is the literal fold-increase in product per cycle (10^(−1/slope)), while efficiency is that factor expressed as a percentage above the starting amount. A factor of 2.0 means 100% efficiency; a factor of 1.9 means 90%. Over many cycles small differences compound dramatically — which is why the calculator also reports the fold amplification across 10 cycles.
Amplification factor 2.0 → 100% efficiency → ~1,024× over 10 cycles
Amplification factor 1.9 → 90% efficiency → ~613× over 10 cycles
Amplification factor 1.8 → 80% efficiency → ~357× over 10 cycles
A 10% drop in efficiency nearly halves yield after 10 cycles
This compounding is why efficiency matching between target and reference genes matters
MIQE Quality Criteria
The MIQE guidelines (Minimum Information for Publication of Quantitative Real-Time PCR Experiments) define what makes a publishable standard curve. Reporting these values alongside efficiency is now expected by most journals.
| Metric | Target | Meaning |
|---|---|---|
| Efficiency | 90–110% | Per-cycle amplification near doubling |
| Slope | −3.6 to −3.1 | Gradient of the standard curve |
| R² | ≥ 0.98 | Linearity / goodness of fit |
| Dynamic range | ≥ 5 logs | Span of template quantities tested |
| y-intercept | Reported | Cq at 1 copy — proxy for sensitivity |
Report efficiency, slope, R², and the dynamic range together — reviewers increasingly require all four for any qPCR-based publication.
Troubleshooting Low or High Efficiency
Efficiency that falls outside 90–110% usually points to a fixable problem in primer design, template quality, or pipetting. Diagnose the direction first: efficiency that is too low typically means under-amplification, while efficiency that is too high (>110%) usually signals an artefact rather than a genuinely better reaction.
- Too low (<90%):
redesign primers, optimize annealing temperature, raise MgCl₂, or check for amplicon secondary structure
- Too low:
PCR inhibitors carried over from extraction (purify or dilute template)
- Too high (>110%):
pipetting error in the dilution series or sample-to-sample contamination
- Too high:
non-specific products or primer-dimers inflating signal (check the melt curve)
Always verify a single clean peak on the dissociation (melt) curve before trusting efficiency
An efficiency above 110% is almost always a methodological artefact — a reaction cannot truly more-than-double its product each cycle.
Key Terms Glossary
Common terms used in qPCR efficiency analysis.
| Term | Definition |
|---|---|
| Cq / Ct | Quantification (threshold) cycle — the cycle where signal crosses the threshold |
| Standard curve | Plot of Cq vs log₁₀ template quantity from a dilution series |
| Slope | Gradient of the standard curve; −3.322 = 100% efficiency |
| Amplification factor | Fold increase in product per cycle, 10^(−1/slope) |
| Efficiency | (amplification factor − 1) × 100% |
| R² | Coefficient of determination — measures linear fit quality |
| MIQE | Minimum Information for Publication of Quantitative qPCR Experiments |
| Dynamic range | Range of template quantities over which the curve is linear |
Quick Reference Card
qPCR Efficiency — Quick Reference
Quick reference • qPCR Efficiency Calculator
Efficiency = (10^(−1/slope) − 1) × 100%Valid range: Acceptable efficiency 90–110%; slope −3.6 to −3.1; R² ≥ 0.98
Common Values
⚠ Watch Out
- •Efficiency outside 90–110% invalidates ΔΔCq quantification
- •Efficiency above 110% signals an artefact, not a better reaction
- •A high R² does not guarantee good efficiency — check both
Pro Tips
- →Use a 10-fold dilution series across at least 5 logs for a reliable slope
- →Run every dilution point in duplicate or triplicate
- →Confirm a single clean peak on the melt curve before trusting efficiency
FAQs
What is a good qPCR efficiency?
An amplification efficiency between 90% and 110% is considered acceptable per the MIQE guidelines, with 100% being ideal. 100% efficiency means the target perfectly doubles every cycle (an amplification factor of 2.0), which corresponds to a standard-curve slope of -3.322.
Why is the standard-curve slope negative?
The quantification cycle (Cq) goes down as template amount goes up — more starting material crosses the detection threshold sooner. Because Cq is plotted against log₁₀ quantity, the line slopes downward, so the slope is always negative. A slope of -3.32 is ideal.
How do I calculate qPCR efficiency from a slope?
Use the formula Efficiency = (10^(−1/slope) −
- 1× 100%. For example, a slope of -3.32 gives 10^(1/3
- 2= 2.0, so efficiency = (2.0 −
- 3× 100% = 100%
Just enter your slope into this calculator to get the result instantly.
What does an efficiency above 110% mean?
An efficiency above 110% is almost always an artefact rather than a genuinely super-efficient reaction — a target cannot truly more-than-double each cycle. Common causes are pipetting errors in the dilution series, PCR inhibitors that affect concentrated samples more, primer-dimers, or non-specific amplification. Check your melt curve.
Why does efficiency matter for the 2^−ΔΔCq method?
The popular 2^−ΔΔCq (Livak) relative-quantification method assumes both your target and reference genes amplify at exactly 100% efficiency. If they don't, your fold-change results are biased. Either validate that efficiencies are near 100% and matched, or use an efficiency-corrected model such as the Pfaffl method.
What slope corresponds to 100% efficiency?
A slope of -3.322 corresponds to exactly 100% efficiency. This comes from −1 / log₁₀(2), because perfect doubling means the amplification factor is 2 and log₁₀(2) ≈ 0.301.
How many dilution points should my standard curve have?
Use at least 5 points spanning 5 orders of magnitude (e.g. a 10-fold dilution series across 10⁵), each run in duplicate or triplicate. A wider, well-replicated dynamic range gives a more reliable slope and a higher R².
What is the difference between efficiency and amplification factor?
The amplification factor is the literal fold-increase per cycle (10^(−1/slope)); efficiency is that factor minus 1, expressed as a percentage. A factor of 2.0 equals 100% efficiency, and a factor of 1.9 equals 90% efficiency.
Can I calculate efficiency without a standard curve?
Yes — alternative methods estimate efficiency from the shape of individual amplification curves (e.g. LinRegPCR) rather than a dilution series. However, the standard-curve method remains the gold standard and is what this calculator and the MIQE guidelines use.
My R² is high but efficiency is poor — what's wrong?
A high R² only means your points fall on a straight line; it says nothing about the line's slope. You can have a beautifully linear curve with a slope of -3.8 (≈83% efficiency). Efficiency and R² are independent quality metrics — report both.
Is this qPCR efficiency calculator free?
Yes, the qPCR Efficiency Calculator is completely free with no registration required. Enter your standard-curve slope to get efficiency, amplification factor, and 10-cycle fold amplification instantly.